The Observer Effect and Debugging: How Dev Tools Can Change Your Code's Behavior
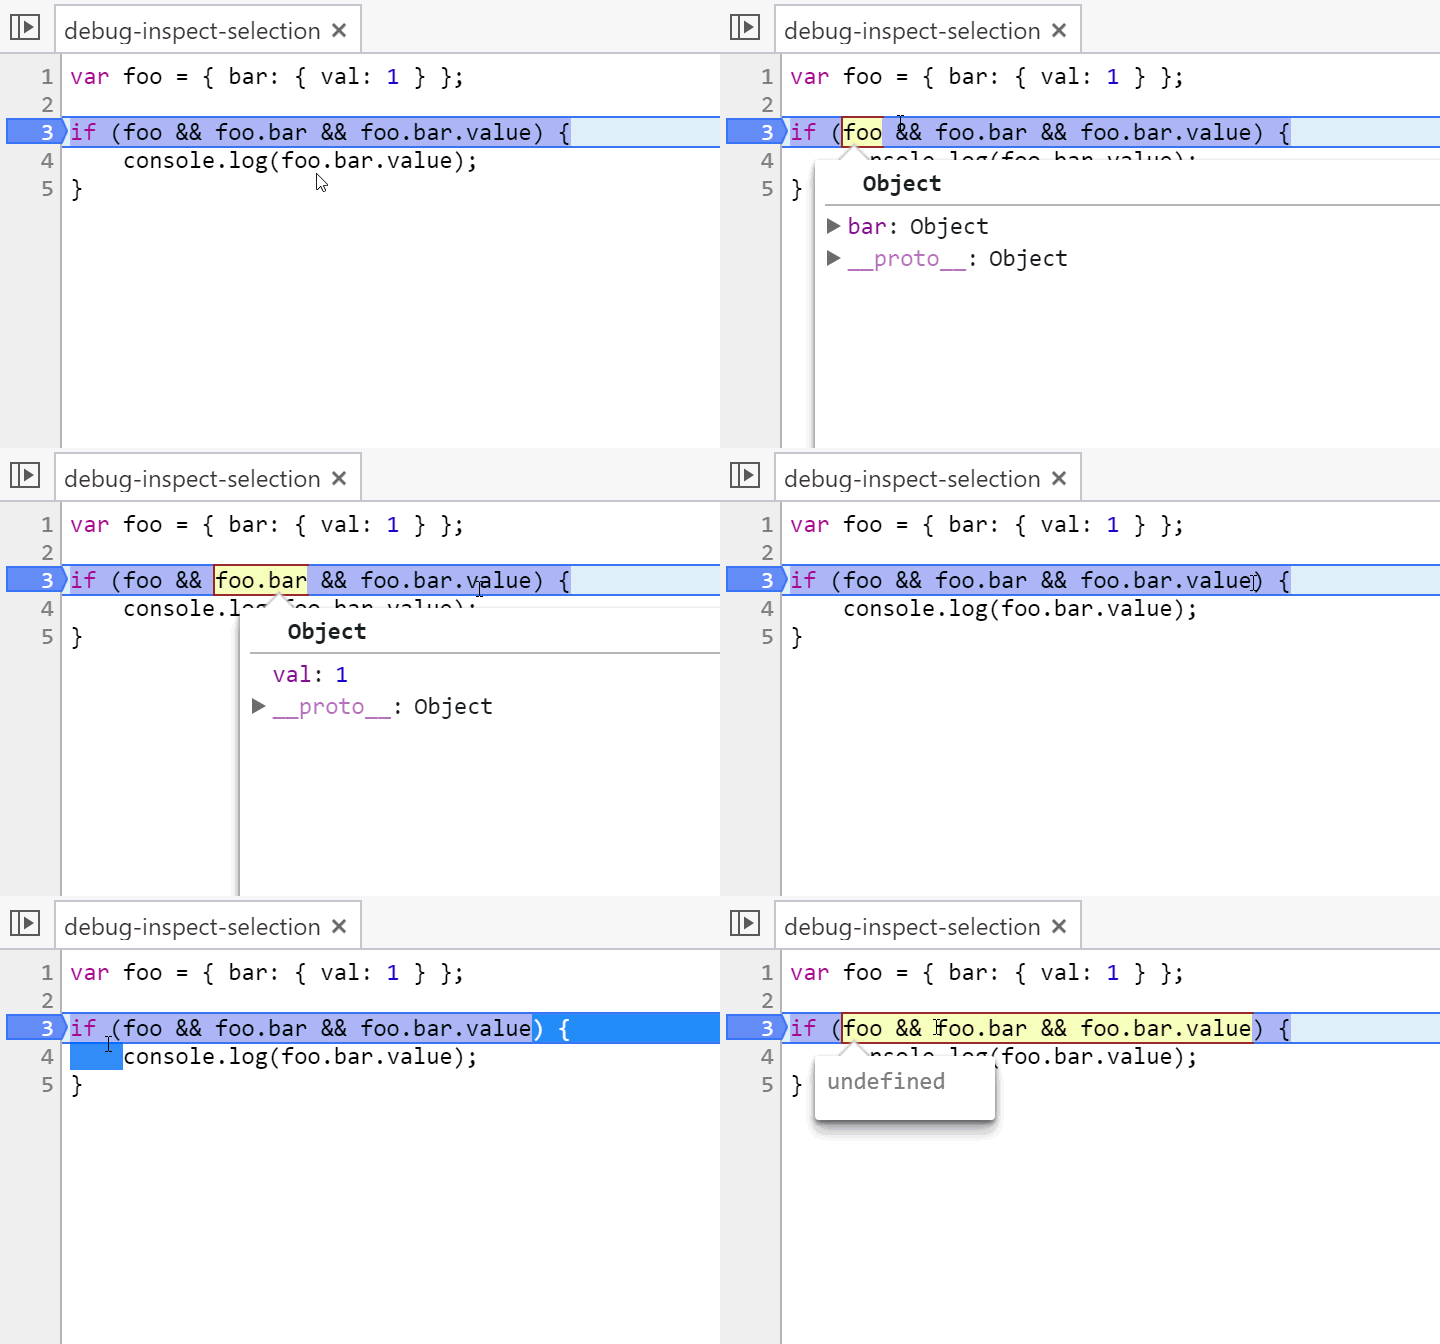
Chrome recently added a new feature to their JavaScript debugger where when you select a piece of code and hover over it, the code is evaluated and displayed in a little popover. In general, this is very useful. You can check the value of a variable, or even look at the results of more complex expressions.

This is super useful, but it can also cause problems if you’re not careful about how you use it.
First, a little physics. The observer effect refers to “changes that the act of observation will make on a phenomenon being observed”. That definition precisely describes the behavior of this Chrome DevTools feature.
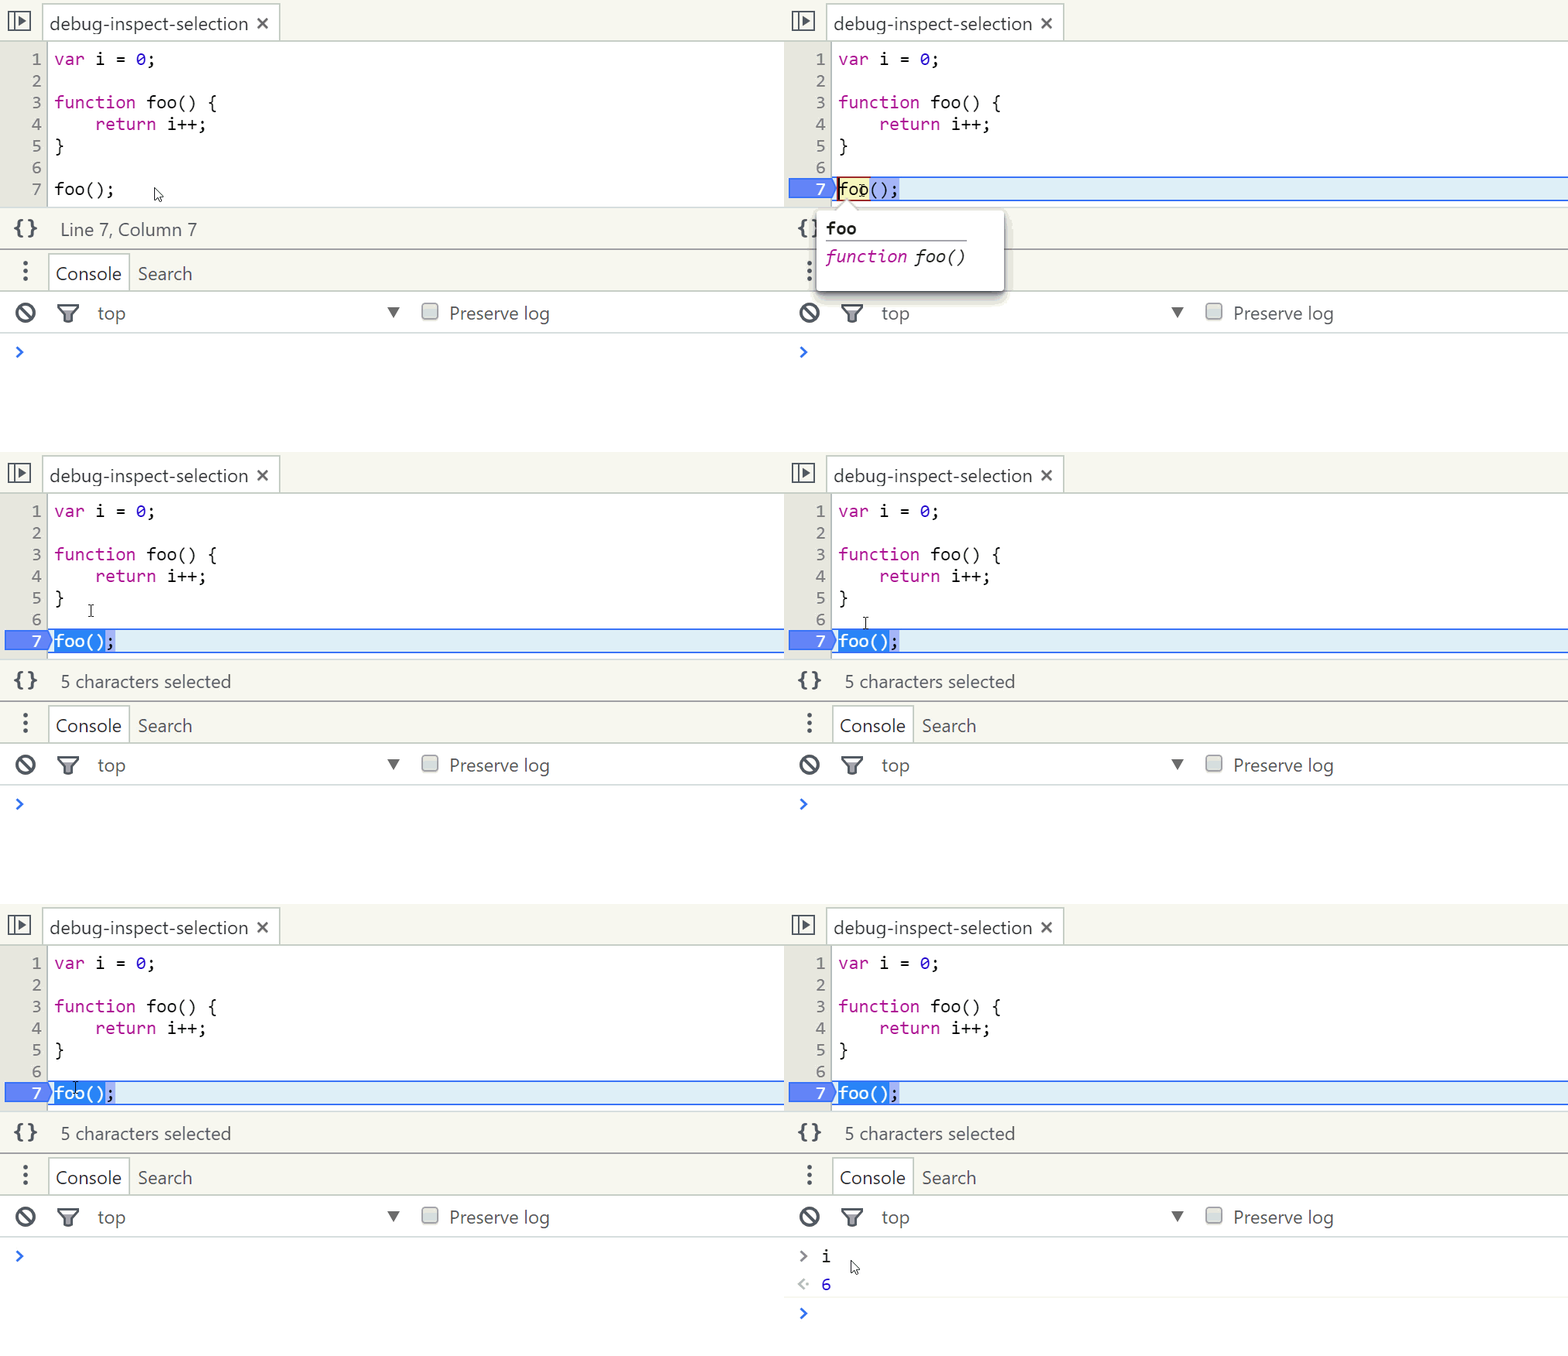
Consider the following example where I highlight a call to a function that has a side effect (incrementing the variable i).
Whenever I hover over the code, it re-runs that expression, and the value of i increases.

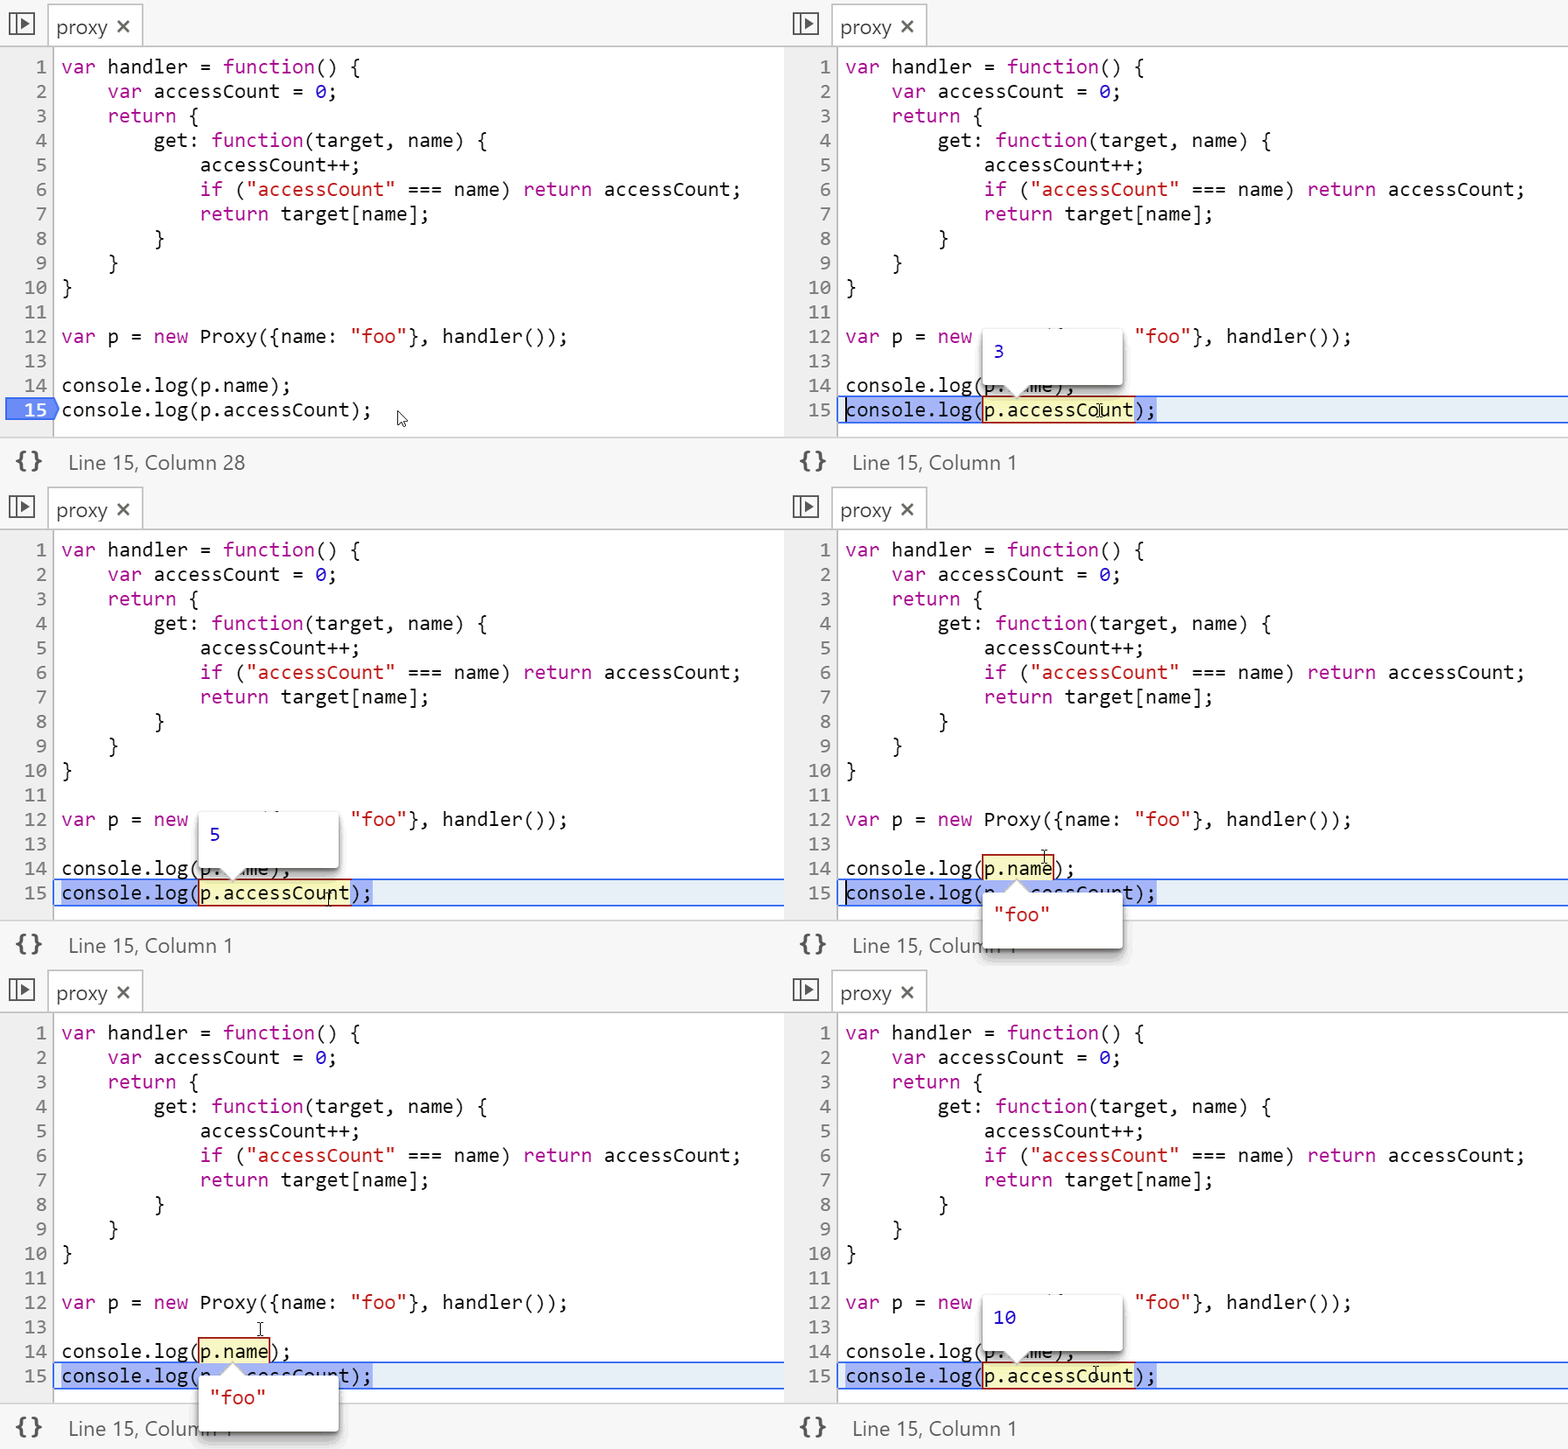
This side effect is fairly benign and easy to detect, but imagine a more complex function with multiple dependencies and obscured side-effects. Worse, you could observe the value of a Proxy object without even knowing it might have side effects.

Obviously this also serves as a warning against side effects in proxy handlers, but the point here is that these previews can affect the behavior of your code in significant ways.
Several years ago, I wrote about verifying your tools after a Fiddler visualizer made a debugging session take much longer than it should have taken. The same principal holds true here. Like many other professions, understanding how your tools behave is an important part of software development.